Friday, May 31, 2013

A Pitch F/X Scouting Report of Didi Gregorius So Far

In the off-season, the Diamondbacks acquired Didi Gregorius for Trevor Bauer in a 3 team trade, a trade that surprised a lot of people from the Diamondbacks side. I always enjoyed watching Gregorius in the minors, as he looked like a shortstop that could do a little of everything, but my statistical system didn't like him very much at all (and FRAA insisted he was a below average shortstop). So far in the Majors with the Dbacks, he has impressed defensively, at least visually, and handled the bat well, though it is certainly a small sample size. I wanted to take a look at his pitch data so far.*

For ease, we are only looking at the data of what he has seen so far this season (and considering he only played in 8 games in the Majors last year, it wouldn't give us much extra data anyway). Here are the speed and spin of all the pitches he has seen so far this year, labelled with locations:

 As expected, he has seen about everything the league has to offer by now as far as simple pitch breakdowns. Obviously that is a somewhat messy graph and a lot of data, so we need to break it down in smaller portions, focusing on balls he has made contact with or swung and missed at. First, let's look at his whiffs:

It really seems like he is whiffing on a lot of fastballs, especially ones up. He especially seems to be struggling against above average velocity, at least whiffing at more than you would expect. On pitches 92 MPH and up, Gregorius has a 12.6 swinging strike percentage versus a 10.94 swinging strike percentage on pitches 88-91.9 MPH. This is a higher swinging strike rate than league average, but the difference between plus and average fastballs seems to be smaller than league average (though we are clearly not working with a large sample size). To get another perspective, the following graph is the release points of the pitchers that have made him whiff so far this season:

It is a pretty diverse group here, with more lefties than righties (no surprise), but some really low righties (which is surprising since he should see that release point better). Here are the opposing pitcher release points on balls Gregorius has put in play (including homers):

The platoon advantage for the left-handed hitter becomes a little more clear here, though he has put balls in play from lefty specialist type release points. Gregorius has 48 whiffs versus 92 balls put in play (including homers, a .52 ratio). League average swinging strike (whiff) percentage is 9.2%, while, from best I can tell, 18.4% of all pitches are put into play (including homers, a .5 ratio). So Gregorius is about league average, maybe a little worse at whiffing versus putting balls in play. Considering he isn't a guy that projects to hit a lot of power, you would like to see a higher ratio, but it isn't alarming yet. First, here is the speed and spin graph for all the pitches Gregorius has "batted", labelled with the fielder who fielded the ball or general direction the ball was hit:
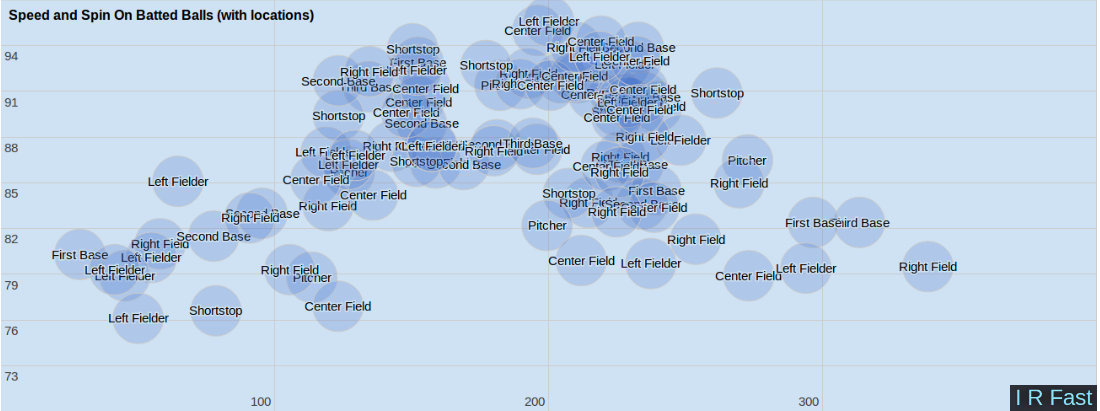
 Comparing to the spin and speed chart of his whiffs, we see a greater concentration of below average fastballs. He also seemed to hit more curves than whiff at them, which is a little unusual. He isn't just tapping them either, as many of them are going to the outfield. Not surprisingly, most of the better than average fastballs he has made contact with are going to the opposite field.

The following graphs will break down the pitches Gregorius is hitting for outs, hits, and run scoring plays. Here are the outs:

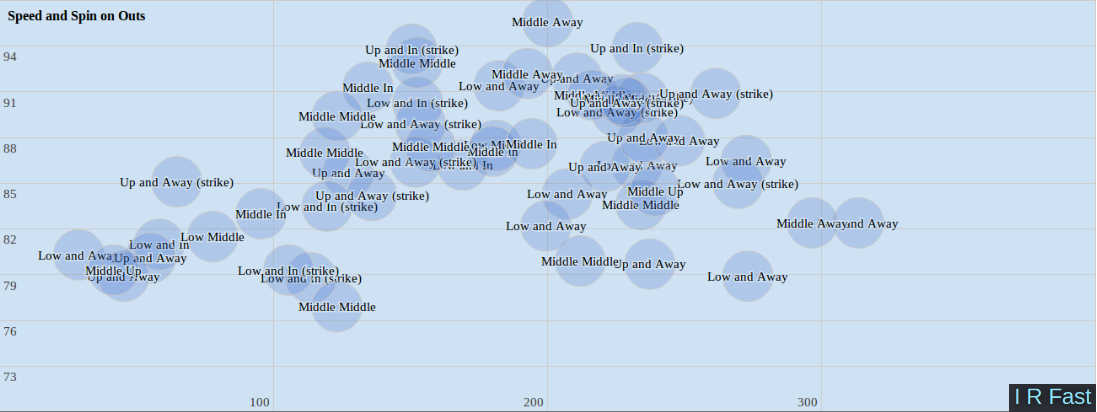
No giant cluster, but a lot of curveballs put in play for outs and a good number of average and below average fastballs. Here are his hits:

Here we see less curveballs and more fastballs, including a cluster of better than average fastballs, especially ones thrown low in the zone. This seems to support the idea of left-handed hitters liking low and in fastballs. Here are Gregorius' run scoring pitches as designated by GameDay (homers and other RBI plays):

The pattern is clear here, as they are mostly fastballs (with some changeups) thrown in the middle part of the plate. They aren't breaking balls, so he isn't merely a mistake hitter, but his power is coming off pitches that are coming off pitches that catch a lot of the plate.

All of his run scoring plays have come on balls hit to right or center field, so here is the speed and spin on pitches that Gregorius has pulled:

Note that the pulled balls are not really on up and in pitches, which is a little unusual for a hitter that is hitting for pull power. If he is whiffing on fastballs, and his success on pull balls is not coming on up and in balls, this does raise a question about bat speed. So this graph looks at all the pitches up and in, both for a strike and not for a strike, along with results:

No surprise that it is mainly fastballs, as breaking balls up there are usually a mistake (but the three clear mistakes have been taken for strikes by Didi). Gregorius is clearly struggling with these pitches however, with 10 swinging strikes and just two balls put in play for no outs. This is obviously his weak zone. Pitchers, especially ones with plus fastballs, should challenge Gregorius up and inside.

To continue the look, here are the pitches Gregorius has hit up the middle:

 A lot of fastballs with what looks like some sliders, with almost all the pitches coming from the low or middle part of the plate. Here are the pitches Gregorius has gone the other way with:


Surprisingly, a lot of breaking balls, with a lot of the pitches overall being pitches that are thrown away, especially up and away that he is just flicking the other way and not trying to pull.

Overall, I think Gregorius is a little more advanced of a hitter than I thought he would be. He isn't flailing at breaking balls or pulling balls he shouldn't. The power he has shown so far is probably mostly a mirage or a product of the ball park and not something I think he will really maintain. You can bust him up and in, which raises some questions either mechanically or bat speed wise. If he doesn't handle inside good fastballs well and all his power is pull, I don't think it is something he will keep up. He seems to be a good low ball hitter and should have success going the other way. If you believe in the defense and athleticism, then it seems that Gregorius is going to do enough at the plate to be a starting shortstop in the big leagues, even if the K/BB might frustrate some.

*I usually Brooks Baseball's Tabular data, but Baseball Savant has made getting spreadsheet data of each player or team very easy, so that is what I used for this post. Keep in mind that the velocities come from the more traditional 50 feet release point than the 55 feet release point Brooks uses, and Drew Willman uses "zones" (which I changed into words for this post) instead of the actual data points for locations.

Thursday, May 30, 2013

Michael Kickham Scouting Report

Michael Kickham, a 24 year old left-handed pitcher, made his MLB debut for the San Francisco Giants on Tuesday. Listed at 6'4 220, he is a tall and lanky looking (at this age, it is unlikely he will add much good weight, but the frame is a little slender). He had to face the Oakland Athletics, and they didn't do him any favors by batting all righties or switch hitters against him. Occasionally, lefties have to deal with outings like this, but even one of the more extreme platoon split lefties in baseball, Chris Sale, still faces lefties 21-27% of the time. So having no lefties to face most likely skewed the results for Kickham, even though he didn't have real platoon splits in 2012.

His delivery is a little funky, with no real fluid motion. Instead, it is somewhat jerky, making the timing a little strange, but allows him to hide the ball a little bit behind him. The ball even comes behind his left hip and then comes out of his body. He seems to be working from the center of the rubber, and his back and right side seem to slump down and work against his throwing motion, as his arm gets very far away from his body in a 3/4ths motion.


Perhaps it was because he never had the platoon advantage, but he showed that he has no qualms with throwing sliders to righties, coming low and in to Chris Young twice in a row and striking him out. The break on it looked a little non-traditional, but he used it glove side like one. The fastball looks like a sinker a good majority of the time, though there were clearly some high 4-seam type fastballs. He didn't appear to be using a cutter, but he would break the sinker into lefties. At that velocity (90-94 MPH), it could really be effective though the change was rare and didn't look great. He really started using the change the second time through the order. When he threw the sinker outside it can it was hit by Jed Lowrie, and then low and inside sinker was hit for the homer by Norris.

His spin and speed chart makes him interesting and difficult to classify:


Kickham's fastball and sinker are of the low spin variety, perhaps a little surprising since he clearly has big league velocity, above average velocity, especially for a left-handed starter.

The MLBAM tags said he threw 5 splitters, but they all had very low "confidence" ratings.  They gave him some curves, which made sense based on the high spin (as a lefty) and negative movement as well. Calling the 2 most upper left pitches curveballs makes sense. He has a separate split and change it looks like, not just from the MLBAM tags, but from the movement data as well (I can't recall many pitchers having both a split and a change). These are the low spin pitches that are slower than the fastball. The spin data isn't going to help us differentiate between the two pitches, and Harry Pavlidis combined the two pitches. I created my own tags for Kickham, and ended up mostly agreeing with the MLBAM tags with the change and splitter, but broke up the fastball and sinker differently because the tags seemed inconsistent. So here are his average locations based on my tags.

Although the change and split seem to be slight variations, and the sinker is obviously just a variation of the fastball, this is a pretty diverse selection of pitches. The curve is more glove side than most, as is the slider, as the average one was outside of the strike zone. He kept the ball a little lower than average, both with the fastball and all pitches. The sinker and change were extreme arm side pitches, with the split being even more so (which doesn't make a lot of sense and was probably not on purpose).

You can see it in picture form above, but this is what Kickham's release point looked like, in graph form, during the game:

Aaron Laffey or Derek Holland aren't bad comparisons for release point, though obviously those are two totally different pitchers velocity and effectiveness wise, with Kickhan being closer to Holland velocity wise, though not quite as good.

Kickham's command really was bad in the 3rd and it got him taken out of the game. His velocity also seemed to fade as well and he couldn't get out of the inning. However, there was no real release point change per inning:

However, he located much differently in the 3rd inning, throwing a lot more pitches arm side, after working glove side in the first two innings:

This is usually a symptom of not finishing the delivery. He was starting games in AAA, so it is unlikely that he got tired in the 3rd, especially since the 1st and 2nd weren't long innings. As the data above shows, it wasn't release point inconsistency either. Watching live, it didn't seem that this was on purpose, as he was clearly missing his spots.

It appears that Kickham will get another turn in the Giants rotation to redeem himself from the bad third inning in his first start. He has a nice assortment of pitches and big league stuff, but delivery repetition may be a little bit of a problem, especially finishing as the game goes along. I am sure this is something that the Giants coaching staff will be looking at mechanically in his next outing.

Wednesday, May 29, 2013

The Evolution of Shaun Marcum

Going into his start against the Braves on Sunday, Shaun Marcum had an ERA well over 6. However, he would go on to pitch very well against the Braves, striking out 12 in 7 innings, with no walks and a homer. When you looked at his numbers before the outing, you realize that his problems were BABIP and LOB % related, as he was pitching reasonably well, with a 4.24 kwERA. Marcum was a very effective starter in 2010 and 2011 with the Blue Jays and the Brewers, with a .103 fWAR per start, but had an injury and wasn't as effective in 2012 with a .062 fWAR per start. So far this year, he has been closer to his 2010-2011 self according to fWAR per start, mainly because he is limiting homers better than he really ever has before. To get a deeper look at the different levels of Marcum, I broke down his Pitch F/X data into 4 parts (technically 5 as I ignored his 2008 season), his 2010-2011 success, his 2012 season, his 2013 season before the Braves start, and the start against the Braves

There was some kind of error with one of the Heyward at-bats as the data didn't show up, so I tossed it (along with any other data sets that had errors). Using the data from baseballsavant.com, here is how Marcum's locations break down by zone:

average zone in 2013: 10.13
average zone on Sunday: 9.82
average zone in 2012: 10.48
average zone in 2010-2011: 10.34

It doesn't seem the zones are predictive for what was wrong, or what went right for Marcum on Sunday, or even the difference between 2010-2011 and 2012. So what about release point? Here we can see a clear change:

Average vertical release point in 2013: 6.3
Sunday: 6.27
2012: 6.13
2010-2011: 6.07

Strangely, despite some shoulder injuries, his release point is creeping up. It isn't what was predictive for what went right on Sunday, and is only really predictive from year to year in a reverse way, meaning it seems that you would have to believe that the higher release point is worse for Marcum. I think it is just descriptive of him changing, but not really prescriptive of success.

Average Horizontal release point in 2013: -.82
Sunday: -.86
2012: -.89
2010-2011: -1.07

Just like with the vertical release point, Marcum has been moving to what you would call a more ideal place, closer to the center of the rubber. Again, it is unlikely that this is making him worse. 

Velocity has never been a key part to Marcum's game, but it is helpful to look at how hard he is throwing anyway (using the traditional 50 feet from home plate measuring stick, instead of the Brooks Baseball way of 55 feet, which makes the velocity tick slightly up). Here is what his velocity has looked like so far this year (broken up by pitches, unlike the rest of the graphs):


Here is what it looked like on Sunday:

He threw what looks like the slowest pitch of the season in the start, but he certainly was not throwing harder. Marcum threw a little bit harder in 2010 and 2011, but you can still probably count the amount of 90 MPH fastballs on one hand:

 In 2012, he saw a clear decrease in velocity:

 
His overall stuff from those 3 seasons doesn't seem to be too different, as far as selection, spin, or rotation goes:


Here is how his spin and rotation looked on Sunday and in 2013 so far:


There were no really high spin pitches for Marcum, but other than that (and the fact that his curve seemed to get a little more rotation), it looked relatively the same on Sunday.

So in conclusion, velocity drop seems to be the most likely explanation for why he is no longer the 3 win pitcher he was in 2010-2011, though there is a location explanation as well. According to Baseball Heat Maps, Marcum threw pitches on the "edge" of the plate 15.9 % in 2012, similar to A.J. Burnett and Chris Sale (257th out of 659 pitchers). Marcum had a 17.6 Edge % in 2010 (88th) and 15.7 % in 2011 (315th). According to Bill Petti, he has a 15.5 Edge % so far in 2013. So it seems that he is working on the edge of the plate a little less than he had previously, which could, if you buy into the philosophy behind that data, explain his high BABIP in 2013. As far as 2013 goes, I think Marcum can still be an effective pitcher. I don't think he is quite as good as his FIP and fWAR says he is because I believe the home run rate will regress back to career norms (and even his non home run DIPs like kwERA at 3.47 currently, will probably regress as well), but he can still be a good starting pitcher, the question is whether or not he will be healthy or not.

Monday, May 27, 2013

Why Do Some Plus (And Average) Fastballs Get Hit?

When working on my post on Kelvin Herrera and his 2013 home run problem, I didn't have a good explanation for why 100 MPH fastballs could be hit so easily. I have written enough posts about pitching velocity and why it is important, so we don't need to revisit the subject here. However, some elite fastballs do get hit, and there are even some elite velocity pitchers that still don't succeed. So it is worth knowing, or at least trying to figure out, why these fastballs do get hit at times. In an effort to find out, using baseballsavant.com (which is a great Pitch F/X website) I downloaded all pitches in the big leagues so far in 2013 (I think as of Saturday) that were thrown at 95 MPH or higher. On a side note, rather than using the traditional location Pitch F/X data, Darren Willman uses zones on his website.

Here are how I understand the zones (in a very simplistic form):


So I looked at the swinging strikes, run scoring plays, hits, and out plays on the 95 MPH + fastballs and looked at things like release point, location, and count to see if there was a common thread for which ones were successful, and which ones were not. Also, for comparison, I looked at every fastball thrown at exactly 91 MPH so far this year, what you might call league average, and looked to see if there was a common thread for successful average fastballs (you may have to click on it to get a full view of the chart)


 Not surprisingly, the 95 MPH + fastballs got more whiffs, and more of the 91 MPH fastballs were put in play. The same percentage of all pitches went for hits, which means that the 91 MPH fastballs have a lower BABIP. I can't really explain why this is the case, as the 91 MPH fastballs have a higher amount of run scoring plays, suggesting that they are being hit harder. This may just be randomness or small sample size. Oddly, the release points of the 91 MPH fastballs are higher than the ones of the 95 MPH + fastballs, and while the lefties are more out, the righties are closer to their body with their release points. 

When looking at the plus fastballs, the vertical release point is the same for all results.  For righties, there appear to be very little difference in horizontal release point, though the closest to the center of the rubber for lefties gets whiffs or outs.

Not surprisingly, even when looking at plus fastballs, the slightly faster fastballs on average are more likely to get whiffs. There is no real velocity difference between the ones that are turned into runs, outs, or hits. The zones suggest that the runs are higher than the rest of the pitches, though there isn't much of a difference between the whiffs and outs/no out pitches. Count, especially when it comes to balls, may be the best indicator, as the less amount of balls the better.

With the average fastballs, height was a bit of an indicator, with higher being preferable somewhat (though outs being better than whiffs and runs better than no out plays hurts the case). The zones broke down much differently than we saw the plus fastballs break down. The higher the number the better it seemed, meaning low or out of the zone got whiffs, while up in the zone gave up runs. It isn't surprising that location is more important for average fastballs than plus fastballs. Horizontal release points, whether left or right, really provided no help with the average fastballs. Count wasn't as helpful as an indicator as it was for plus fastballs as well. 

One thing this obviously doesn't take into account is hitters faced. We didn't look at platoons, and we didn't look at quality of hitter. By definition, better hitters will provide worse results for the pitchers on average. With that said, we didn't really see anything we didn't expect, though I thought release point would play a bigger role than it did. Getting ahead in the count early is very important for elite fastball pitchers, to just to keep hitters off balance and make sure they aren't sitting on the fastball. For average fastballs, location really provided the difference.

Sunday, May 26, 2013

Behind Sean Nolin's Bad Start

The Toronto Blue Jays turned to 23 year old lefty Sean Nolin to make a spot start for the big league team earlier in the week. A 6th round pick in 2010 out of college, Nolin was ranked as the Jays 19th best prospect by Baseball America to start the year, and 9th in the system by FanGraphs' Marc Hulet. His big league debut didn't go well, to say the least, as he recorded just 4 outs, striking out none, and gave up 6 runs.

Nolin is a large pitcher, listed at 6-5, 235. Here is his release point, along with all the locations of his pitches:

Nolin's average release point is probably closest to Joe Saunders (Mark Hendrickson and Clayton Kershaw are sort of close). He definitely had some problems repeating it in his outing, mainly in a horizontal way, probably meaning he was standing on the rubber slightly different for some of the outing (in the homer we will look at below, we will see that he is standing in the center of the rubber). The height seems fine, so I don't think it is a huge concern. What does seem concerning is how much he threw the ball arm side. When he did go glove side, it was almost always way off the plate. Using the MLBAM tags, here is what his average strike zone looks like:

The slider and cutter were thrown arm side (as they usually are), but everything else is pretty extreme arm side. We are using the MLBAM tags for him in this post, but as his spin and speed chart shows, they are demonstrably wrong on some pitches:

There seems to be some confusion between the slider and the cutter, and whether he has a changeup or a moving fastball (at that velocity difference, especially with it being that demonstrably separated, it almost has to be a change).

Obviously he was hit around in his start, so let's look at his locations on pitches that were hit for hits or run scoring plays (technically the in play, no outs designation and the in play, runs designation):

The two well located curves are interesting and raise some questions. One was a single, which could be luck, while the other one was a home run, which is a little less likely to be the result of randomness or luck. The homer was given up to right-handed hitter J.J. Hardy, who isn't especially good at hitting balls low, but is good at hitting breaking balls low, at least much better than league average. You can see the homer here, it was on an 0-2 count and the pitch was nearly in the dirt, and Hardy somehow manages to pull it for a homer. At 74 MPH (most likely about 72 MPH in Toronto), it isn't especially slow, but maybe slow enough to adjust to.

Mechanically, Nolin uses a pretty high leg kick to try to hide the ball, doesn't have great posture at time of delivery, not really twisting his back, but appearing to be very low and not upright. His arm angle comes up above his body, like this:

One would think that this negates anything the leg kick does (other than just making it a timing device) in providing deception, as it seems like he lets hitters see the ball more than a traditional delivery would. The head tilt is obvious, perhaps why he pulled a few of the balls, but again he threw mainly arm side, suggesting he was having more of a problem finishing his delivery.

The first conclusion is pretty obvious, Nolin wasn't ready for the big leagues and probably shouldn't have started that game. If we adjust for Toronto's apparent velocity friendly radar gun, his fastball seems to be a little below average, with some kind of cutter/slider, a change, and a curve that apparently isn't very effective. It can be tricky to make pronouncements on a player's future based on the data of one bad game, but the stuff looks pretty vanilla overall. Perhaps Nolin can be a back end starter in the somewhat near future, but he doesn't look like a real impact starting pitcher.

Saturday, May 25, 2013

Charting Shohei Otani's First NPB Start

Last year, Shohei Otani was the talk of the baseball world for a short time, thanks to being a YouTube sensation for hitting 100 MPH in high school. Rumored to be interested in a MLB deal, I wrote about him for another site, but he was drafted by the Nippon Ham Fighters, and signed with them. The Fighters have used him as a positional player in the NPB, and then sent him to the Ni-Gun to pitch. Earlier in the week, they let him make his NPB debut as a starting pitcher. This post is about his first start, charting him from both watching his outing, and the Yahoo data from the NPB version of Gameday. Each pitch is classified, but I also classified each pitch on my own, just from a live standpoint. In the spreadsheet below, I recorded the pitch data given by Yahoo, along with my own classifications, and transferring the kilometers to miles per hour. I sorted the spreadsheet by opposing hitter:
 First, let's look at his velocity breakdown chart, this one sorted from pitch 1 to pitch 86:


Otani reached his peak velocity about midway through his outing, and wasn't throwing as hard at the end of the game as he was at the start of the game. This could be because of how his pitch schedule at the start of the season was off because the Fighters wanted to use him as a position player. His arm strength may not be all the way built up. 

Here were his pitches according to my classifications:

50 Fastballs: 93.32 MPH, 25 in the strike zone, Middle High and Glove Side and Low the most common locations (10 each)

8 Two-Seamers: 91.63 MPH, 5 in the strike zone, Glove Side Middle, Arm Side High, Arm Side Middle all had two locations.

6 Sinkers: 94.86 MPH, 1 in the strike zone, Glove Side and Low the most common location.

18 Sliders: 79.29 MPH, 6 in the strike zone, Glove Side and Low the most common location.

2 curves: 63.24 MPH, 0 in the strike zone, Glove Side and Low and Arm Side and Low.

1 change: 80.6 MPH, not in the strike zone, Glove Side and Low.

This is how the Yahoo data broke up his pitches, in case you were wondering:

19 sliders: 79.36 MPH

65 Fastballs: 93.25 MPH

2 Curves: 63.24 MPH

The first thing I notice is that the slider velocity doesn't match the fastball velocity. Otani's slider was the slider that breaks just vertically, like a lot of sliders you see in Japan, often called something like a baby slider. It doesn't look like a hard curve, but it would make more sense when comparing velocities that he has a hard curve and slow curve. When you look at starters in the Pitch F/X era that have an average fastball of 93-94 MPH, Daniel Cabrera had the slowest slider at 81.4 MPH. Two of those pitchers even have curves over 80 MPH on average. Otani's slow curve acts somewhat like an eephus pitch, similar in velocity to Paul Maholm's eephus. The lack of a changeup is something that I think MLB teams will look at and consider when scouting Otani, as none of the qualified starters in the Pitch F/X era that threw 93-94 MPH on their fastball didn't have a changeup. I counted one, a slider/curve (according to Yahoo) against a lefty that dropped differently. Whether he threw one or none in the start doesn't really matter, it is something I think he really needs to develop to get out lefties. Anecdotally, it seemed that he got really fastball heavy when he faced lefties. It is nearly impossible to make MLB comparisons because of how his slider acted and his lack of changeup or some kind of cutter (his fastball has a lot of movement, but it is usually arm side tail, breaking back like 2-seamers).

Overall, Otani threw pitches in the strike zone 43 percent of the time. In the Pitch F/X era, only 5 out of the 201 qualified pitchers have a lower zone percentage than that. Strangely, only Francisco Liriano is extremely wild out of them, and he is the only one that you can really call a hard thrower (Gee, Hellickson, Lowe, and Vogelsong being the other four). A low zone percentage doesn't mean you can't succeed, as Hiroki Kuroda has only thrown 43.5 percent of pitches in the strike zone in the Majors, and the highest zone percentage pitchers seem to be less successful. Throwing strikes, can, at times, be overrated. The important thing is to miss bats. Here is Otani's approximate strike zone for the game in a really simple zone chart (catcher's perspective, I am not sure why it is stretching weirdly, and didn't keep my format to show the actual strike zone, which is the middle three rows and columns):


11 7 1


2 5 2

1 3 4 11 3


2 3 5


4 3 19


His favorite zones were low and away and throwing it high and arm side. Anecdotally, most of the high and arm side pitches were mistakes where he didn't finish his delivery. Perhaps one way to get out lefties, especially lefties in Japan, who don't face a lot of elite velocity pitchers, is to throw hard fastballs inside on them. It would seem that it would be better for Otani to throw those fastballs high and in to them get them out, rather than low, and then go low and away with the 2-seamer, something he didn't do very much. I found it interesting that both slow curves he used were against Iwamura and Milledge, two former MLBers. He threw a lot of fastballs to both of them, but focused on keeping the ball away from them.

A big thanks to Kazuto Yamazaki (@Lablynne) for pointing out the videos on YouTube, Patrick Newman (@NPBTracker) for helping me with the Yahoo data, and @YakyunightOwl as well.

Thursday, May 23, 2013

Kevin Gausman's First Start, A Pitch F/X Perspective

Kevin Gausman, the Orioles first round pick in 2012, made his much anticipated MLB debut against the Toronto Blue Jays. It went reasonably well and many national writers noted scouts raving about his stuff. Let's look at the 22 year old from a Pitch F/X perspective.

His closest release point comparison is Jair Jurrjens or Philip Humber, two sort of frustrating pitchers in the Majors that didn't age very well. Here is what his release point looks like in graph form:


I see three pitches, A fastball, a changeup, and a hard curve (the movement data suggests it is a curve, not a slider). Here is his spin and speed chart:


The first thing I noticed was that his velocity was much better than what I saw in Spring Training. I did mention the gun might have been slow on the TV that day (though Neimann and Bundy both proved to be velocity decliners and injured), or Gausman could have just been having a off day velocity wise (or didn't have the arm strength built up yet). It should be noted that I am using Brooks Baseball's scraped data (by just exporting the tabular data and then manipulating it to look like how I want), which because of the release point, adds some velocity as well (though I compare it to other Brooks' leaderboards). Also, remember that we saw that Toronto's Pitch F/X system has been very hot this year.  Assuming that hasn't been corrected, I'll post the regular Brooks Baseball average velocities of his pitches sorted by my tags, along with an adjusted MPH of 2 MPH less. The adjusted MPH will be the velocities I will make the comparisons with.

Fastball: 97.26 MPH, 95.26 Adjusted MPH. Michael Pineda is the closest comparison.

Horizontal Movement: -6.23. Koji Uehara is the closest comparison and it is more than Pineda's.

Vertical Movement: 8.88. Santana and Jimenez are the closest comparisons and it is more than Pineda's.

Curve: 83.56 MPH, 81.56 AMPH. Johnny Cueto.

Horizontal Movement: 2.29. Jeff Suppan. Less than Cueto

Vertical Movement: -2.04. Jon Garland. Less than Cueto.

Change: 84.32 MPH, 82.32 AMPH. David Pauley.

Horizontal Movement: -5.2. Tommy Hunter. Less than Pauley

Vertical Movement: .2. Brandon Webb. Less than Pauley

So just stuff wise, you see why he was such a high draft pick and a big prospect, because of the fastball. The change and curve don't bring as good of comparisons as his fastball. Let's see where he located these pitches on average:


He works more arm side than most right-handers, at least being more extreme. Perhaps he wasn't finishing his delivery, or maybe it is on purpose, it is hard to tell in one start (unless you are a mechanics expert). The change and curve were both located well low in the zone on average (the curve being glove side rather than straight down the middle). The fastball was only mid plate high, so he worked low in the zone overall. 

His last pitch was over 97 MPH (non adjusted), so it seems that he maintained his velocity well, and didn't just show off early and then dip off. I do wonder what the release point data means, and whether that means he won't be able to repeat his delivery long term (he repeated his arm slot well in the game, for what it is worth), but the fastball is very good, and he locates the other two pitchers (or at least he did in the game), so I don't think that the overly arm side pitching means a lot, and there are more reasons than not to believe that Gausman will be a good pitcher in the big leagues.

Wednesday, May 22, 2013

Jedd Gyorko Pitch F/X Scouting Report

Jedd Gyorko made the San Diego Padres out of spring training as a bat first infielder. My odds system had him as the 11th best hitting prospect in AA or AAA last year, just behind Oscar Taveras (he was still in the top 70 after considering defense and baserunning). So far, he hasn't disappointed, with decent peripherals and good power numbers through a little more than a month and a half. In this post, I will look at what the pitch data says about him and whether we can expect continued success.

First, let's see where pitchers are throwing to him on average along with where he is having success:


As you can see, the average pitch is low and on the outside part of the plate, a little lower is where his average whiff is. There isn't much of a difference between his hits and outs other than the hits are very slightly closer to the center. The runs scored (homers and RBI plays) at-bats are on the inside part of the plate. So it really isn't height that drives his power, like many hitters, it is balls on the inside part of the plate. So bat speed is probably not an issue for him, but let's look at the kind of pitches he is seeing:

He has seen a pretty good balance of pitches, and he has seen a good variety of pitchers as well:


While his strikeout rate is about league average, his whiff percentage is above league average (suggesting that some kind of correction could be coming). Here are the pitches he has whiffed on:

A pretty diverse mix here, some average fastballs, some plus fastballs, a lot of what looks like sliders or hard curves, a good amount of changeups, and some lefty high spin slow curves. Here are those pitchers' release points:

He hasn't swung and missed at any extreme righties, but has whiffed at a surprising amount of left-handed pitchers, especially the far out ones (perhaps because they are throwing so much off-speed and breaking pitches). He hasn't whiffed at any of the over the top pitchers or pitchers that are very close to the center of the rubber. How about on contact? Rather than distinguishing hits and outs (or even runs), I assumed they were the same for our purposes. Here are the pitches he has hit:

The big difference in this is the lack of slow curves hit, and the amount of fastballs, both plus and average is much more when it comes to contact than whiffs. When you look at his contact release points, he has made contact on a good amount of far out righties, some of the over the top pitchers, but not a ton of lefties:

Obviously looking at splits at this point of the season isn't very helpful, but he has been a reverse splits guy by strikeouts so far (though power and BABIP is on the side of Gyorko against lefties). It may be helpful to look at how he is being pitched by lefties:

Similar to his overall strike zone, he is pitched low and outside, has success on inside pitches, and misses a lot of pitches low. That location is where you would expect curveballs to be, and as we saw above, he struggled with the high-spin left-handed curve. Luckily for Gyorko, not many pitchers in the majors throw a real slow curve, so his strikeout rate against lefties might be a little inflated and due to regress some.

Overall, Gyorko has shown that he has real MLB hitting abilities, handling the inside ball and good fastballs really well. Adjusting to the outside and low breaking ball has been a little bit of a struggle so far, and something he will need to improve on if he is going to be a consistent hitter in the big leagues.

Tuesday, May 21, 2013

Nick Castellanos' Plate Discipline

Nick Castellanos was ranked as the 21st best prospect in baseball before the start of the 2013 season by Baseball America and for the last three seasons has been ranked as the best hitter for average in the Tigers' system. However, my odds system didn't like him very much, ranking him at 272nd (just above Cale Iorg, who the Tigers would release in spring training) overall, and 51st when looking just at the odds (just the offensive component). For his career, he has walked just 7.48 % of the time, striking out nearly three times as much as he has walked, with just 21 career homers (1.52%). To get a better look at his plate discipline, I watched his at-bats in his series in Durham on April 23-26th (as the feed has a broadcast radar gun and good quality in general). The game on the 24th didn't have the quality broadcast though, and the archived version cut off his first at-bat on the 23rd, so I only ended up with 52 pitches, which really isn't enough to make any real judgments about. So I will just show you the data below, sorted from first pitch logged until his last at-bat in the series, and then make a couple of observations (the formatting doesn't even up well, sorry about that):

Velo    Location    In Strike Zone    Class    Result
87    Low and Away    Yes    Fastball     Flyball
76    Low and Away    Yes    Breaking    Called Strike
76    Up and In    No    Breaking    Ball
84    Low and In    No    Offspeed    Flyball
87    Up and In    No    Fastball     Flyball (Homer)
93    Low and Away    Yes    Fastball     Called Strike
93    Middle Up    Yes    Fastball     Foul
93    Up and Away    No    Fastball     Ball
93    Low and Away    Yes    Fastball     Called Strike
94    Middle In    Yes    Fastball    Foul
98    Middle Middle    Yes    Fastball    Called Strike
97    Low and Away    No    Fastball    Ball
95    Middle In    No    Fastball    Groundball
81    Low and In     No    Offspeed    Whiff
95    Middle Up    No    Fastball    Whiff
95    Middle Up    No    Fastball    Ball
84    Low and In    Yes    Offspeed    Foul
86    Low and Away    No    Breaking    Whiff
95    Middle In    No    Fastball    Ball
83    Middle Low    No    Offspeed    Ball
95    Middle In    No    Fastball    Foul
87    Middle Low    No    Breaking    Whiff
86    Low and In    No    Offspeed    Ball
86    Middle Middle    Yes    Breaking    Foul
95    Low and In    No    Fastball    Ball
83    Low and Away    No    Breaking    Whiff
83    Low and Away    No    Breaking    Ball
92    Low and Away    No    Fastball    Ball
82    Low Middle    No    Breaking    Ball
80    Low and Away    Yes    Offspeed    Strike
90    Low Middle    No    Fastball    Ball
81    Up and In    Yes    Breaking    Groundball
81    Middle Middle    Yes    Offspeed    Groundball
92    Middle In    No    Fastball    Ball
93    Middle Up    No    Fastball    Whiff
92    Middle Middle    Yes    Fastball    Whiff
84    Middle Middle     Yes    Offspeed    Flyball
92    Low and In    Yes    Fastball    Foul
88    High and Away    No    Fastball    Foul
92    Low and In    No    Fastball    Ball
92    High and In    No    Fastball    Whiff
89    Middle Up    Yes    Fastball    Groundball
95    Middle Middle    Yes    Fastball    Foul
96    High and In    No    Fastball    Ball
97    Middle In    No    Fastball    Ball
97    Middle Up    No    Fastball    Flyball (Homer)
95    Middle In    Yes    Fastball    Called Strike
96    Middle In    No    Fastball    Ball
82    Low and Away    No    Breaking    Whiff (check swing)
82    Low and Away    No    Breaking    Ball
96    Low and Away    No    Fastball    Whiff

Castellanos has hit 4 homers all year, and 3 of them were in that series (only 2 of them in at-bats charted though). Both of them were fastballs up (one at 87 and one at 97 MPH). There was no one spot where he consistently whiffed, but all but one of them were on pitches outside of the strike zone.

We also get some help from Minor League Central, who break down some plate discipline numbers pulled from MiLB's Gameday. So far this season, he is seeing just 3.56 pitches per plate appearance, well below the International League average of 3.84. He is seeing strikes over 2 percent more than average, showing that pitchers don't seem to be scared of his power, but he is at least making them throw strikes. His swing percentage is way above average and his contact percentage well below average. Trusting zone/outside zone swings is a little tricky because they are done by human stringers (just like me judging if a pitch was or wasn't in the strike zone), but according to that data, he is swinging at more pitches in the zone than average, and less out of the zone than average. His power numbers, both on percentage by contact and by fly-ball, are well below league average.

It should be noted of course, that Castellanos is the 2nd youngest hitter in the International League. He is even younger than Wil Myers and has a similar OPS. According to Baseball Reference, Castellanos has not yet faced a pitcher that is younger than him, so the very fact that he is holding his own so far probably means something. The problem is, I am not sure what it means. Throughout the minors, Castellanos' offensive value has mainly been through high averages driven by high BABIPs. He doesn't have great speed, and while he is large, he doesn't have good power, so it is unlikely he is just hitting the ball too hard for minor league fielders to field. To me, he doesn't have a diverse enough set of skills to be considered a great prospect. He doesn't field exceptionally well or have great positional value, he doesn't run hardly at all, and he doesn't walk or hit for power. If you think he is going to succeed as a Major League player, you have to believe that he is going to continue to hit for high averages with high BABIPs (or develop power with his size, which I think is actually more likely).

Monday, May 20, 2013

Josh Collmenter: Dominant Reliever, Mediocre Starter

Since coming up to the big leagues in 2011, Josh Collmenter has been used in a variety of roles by the Diamondbacks. The right-hander known for his extreme over the top delivery has been much better as a reliever than a starter. Rather than the normal (2013 so far) split of 4.06 kwERA and 2.85 HR % as a starter and 3.84 kwERA and 2.48 HR % as a reliever (.22 kwERA and .37% difference), Collmenter has a career 3.97 kwERA and 3.3 HR % as a starter, and 3.13 kwERA and 1.48 HR % as a reliever (.84 kwERA and 1.82 HR % difference).

As a starter, Collmenter's average release point is  -.48 horizontal, 7.18 vertical and here is what his Spin and Speed Chart looks like:


He sure seems easy to classify, but the MLBAM tags have problems with the fastball and changeup differentiation so I classified his pitches myself using the chart as a guide:

average pitch 84.25 MPH
Fastball: 87.97 MPH
Change: 77.50 MPH
Spin Curve: 70.35MPH
Non-Spin Curve: 70.49 MPH

Collmenter's big platoon splits (4.36 kwERA and 2.96 HR % against lefties, 3.17 kwERA and 2.79 HR % against righties) seem weird since he throws straight over the top and throws a lot of changeups. 

Here are his average locations as a starter, broken down by pitch:


He doesn't work on the arm side part of the plate like most right-handed pitchers do, instead working right down the middle of the plate. The fastball is thrown in the high part of the plate, and with that velocity, it is easy to see how that would lend to some power. The high spin curve is thrown lower than the regular curve on average, and his average pitch overall is thrown right down the middle.

As a reliever, Collmenter's average release point is -.36 horizontally, and 7.23 vertically, so a little bit higher and closer to the center (though nothing real drastic). Here is what his pitches look like as a reliever:


It seems that the difference in  spin between the fastball and changeup lessens in the bullpen. That may mean nothing, or it may mean that they are tougher to distinguish for a hitter trying to guess. Here is the breakdown of his pitches:
Average Pitch: 85.1 MPH
Fastball: 88.17 MPH
Change: 77.98 MPH
Spin Curve: 71 MPH
Non-Spin Curve: 71.32 MPH

So on all pitch types, Collmenter actually has gained less velocity on average than most pitchers who move from the rotation to the bullpen (or vice versa). I think velocity doesn't have much to do with his splits from the bullpen to the rotation, as he is well below average as a starter and well below average as a bullpen pitcher. So how about location differences?:

The spin curve is thrown out of the strike zone (and is a little more rare), while the regular curve is actually thrown much higher than as a starter. His fastball is at about the same height, but actually a little glove side. Other than the change, which is a little more arm side, his pitches go a little more glove side on average.

There is always the chance that as a starter he is just a victim of his home ballpark or the home run rate is just due to regress. The locations are different, especially with the fastball versus the changeup as a reliever, and this may give him a little more deception and help him avoid power more. But, other than that, it is a little hard to see the difference in Collmenter as a reliever and as a starter, so I wonder if a lot of the difference in numbers is small sample statistical noise.

Sunday, May 19, 2013

Free Agent Fantasy Team: Jeff Keppinger's Horrible 2013

This week's Free Agent Fantasy Team update actually contains a few roster moves. First, I signed Rick Ankiel to the big league team with the Mets. I am assuming that it is for league minimum prorated over the rest of the year. For now, we will assume he is owed 367,500 dollars. This brings my payroll up to 99.9785 million for the season, meaning I have about 8.02 million dollars for the rest of the season. I also had to move David Ross to the minors/inactive part of the team as he is on the 7 day concussion DL. To make room, I released Mitch Maier, who has played all of 8 games in the minors this year. Here is the numbers for my team:

Since most teams have played 42 games so far:

7.2 fWAR, 19.548 wins, 22.452 losses

9.7 rWAR, 22.048 wins, 19.952 losses

7.3 WARP, 20.74 wins, 21.26 losses

2.1 WAA, 23.1 wins, 18.9 losses

Again, WAA likes my team the best, but we are over .500 by two metrics now, with Fangraphs liking the team the least again.

Jeff Keppinger has been the most frustrating player on the team (if you don't count Ryan Madson's ever evolving injury situation), getting a 3 year contract after a good season with the Rays and hitting .188/.190/.208 through a month and a half. Keppinger finally drew his first walk this year earlier this week, which even for his contact happy ways is amazing.

This graph shows where pitchers are pitching him on average by count:

 Here are the pitches Keppinger is swinging at:

There are some definite chases, but most of the pitches are obviously in the strike zone.

Here are the pitches he is taking:

Even when he is taking, the pitchers are filling up the strike zone. Even with no strikes, as we saw in the first chart, pitchers are basically throwing it right down the middle. It is not like he is just chasing wildly and not seeing strikes.
Since pitchers are throwing him so much strikes, you wonder if bat speed is a problem (after all, he isn't making them pay), so here are the locations and results on fastballs over 95 MPH:

Most of them are thrown for strikes and thrown away from him. He has put quite a bit in play, but they are almost all for outs. It is contact, but contact that is not paying off. According to Baseball Heat Maps, he isn't hitting the ball as far:

2012: 173.864 feet on average
2013: 162.152 feet on average

Of course, there is a catch/no-catch bias in these numbers, so if he is having a large amount of balls just hit right at people, then it is going to show up in batted ball distance.

Here is Keppinger's spray chart (Texas Leaguers) at this point last year:

So far this year:

While he was hitting the ball harder last year according to the batted ball distance, his spray chart, if you ignore hits versus outs, looks better this year. Other than a pair of pulled homers, he was not hitting the ball very hard at all. He is driving the ball to center much better this year, it just isn't turning into hits. It is really hard to imagine his final line looking pretty at the end of the year, but he should "regress", and start hitting better than he has results wise. I think the best approach here is to be patient and give him more time (certainly the White Sox aren't going to already give up on a 3 year contract).